
Introduction
Fibonacci retracement is a tool used in technical analysis in stock market. Fibonacci retracement levels are plotted horizontally on a chart to indicate possible support and resistance levels.
Each level is shown as a pecentage. The Fibonacci retracement main levels are 23.6%, 38.2%, 61.8%.
This has been observed numerously, whenever a stock moves either upwards or downwards sharply, it generally tends to retrace back before its next big move.
For example – you might have seen a stock does go for a rally up from Rs.80 to Rs.150, then it is likely to retrace back to probably Rs.115, before it can move Rs.180.
The percentage 23.6%, 38.2%, 61.8% shows it’s level of retracement.
Therefore in order to understand Fibonacci retracements better, one must know about the Fibonacci series.
Today we will be understanding this concept and how to apply this in your trading.
But before you know more about fibonacci retracement, it is very important to understand where does it come from.
What Is Fibonacci Series?
Leonardo Pisano Bogollo an Italian mathematician from Pisa, known to his friends as Fibonacci discovered Fibonacci numbers.
Around 1200, mathematician Leonardo Fibonacci discovered the unique properties of the Fibonacci sequence.
He was also considered as “the most talented Western mathematician of the Middle Ages”.
Fibonacci popularized the Hindu–Arabic numeral system in the Western World primarily through his composition in 1202 of Liber Abaci(Book of Calculation).
This is how the Fibonacci Series works
The Fibonacci series is a sequence of numbers starting from zero. You need to keep adding the prior two numbers, you end up with a number string like this:
0, 1, 1, 2, 3, 5, 8, 13, 21, 34, 55, 89, 144, 233, 377, 610, 987…series extends to infinity.
Observe the following
1+2=3, 89+55=144, 987= 610+377, 13= 8+5
One more important factor is when you divide any number in the series by the previous number the ratio is always approximately 1.618. This is also know as PHI.
You might have studied this in your school as well.
For example
987/610=1.618 , 55/34=1.618 , 144/89=1.618
This vital ratio is also known as the Golden Ratio.
This number or ratio has so many names likes the Golden mean, the Golden section, divine proportion, etc.
We will know what exactly it means at later stage in this blog.
In like manner when a number in the Fibonacci series is divided by its next succeeding number you will always get the ratios in same percentage.
Check this below For example:
610/987 = 0.618
89/144 = 0.618
144/233 = 0.618 , 0.618,
So when you convert it in percentage it’s 61.8%.
Similar regularity can be seen when any number in the Fibonacci series is divided by a number two places higher.
For example:
34/89 = 0.382
89/233 = 0.382
377/987 = 0.382 ,
0.382 So when you convert it in percentage it’s 38.2%
In the same fashion in the Fibonacci series when a no. is divided by a number 3 place higher.
For example:
3/13 = 0.236
21/89 = 0.236
34/144 = 0.236 ,
0.236 when expressed in percentage terms is 23.6%.
What Is Golden Ratio Formula?
Fibonacci numbers are found throughout nature, and therefore many traders believe that these numbers also have relevance in the financial markets.
Fibonacci sequence bind directly into the Golden ratio because if you take any two successive Fibonacci numbers, their ratio is very close to the Golden ratio.
As an illustration check few facts below :
- If you divide the female bees by the male bees in any given hive, you will get 1.618.
- Sunflowers, which have opposing spirals of seeds, have a 1.618 ratio between the diameters of each rotation.
- Try measuring from your shoulder to your fingertips, and then divide this number by the length from your elbow to your fingertips.
- Try measuring from your head to your feet, and divide that by the length from your belly button to your feet.
- Flower petals, Seed heads, Pinecones, Tree branches, Fingers, Animal bodies, DNA molecules etc.
- you can know more about how Golden ratio is found throughout universal, planets.
- You can search in Google about the golden ratio trust me you will be surprised.
How do you place Fibonacci retracement on chart?
Fibonacci retracements plotted on chart using horizontal lines. You need to first identify the 100% Fibonacci move.
The 100% move can be an upward rally or a downward rally. This lines indicates areas of support or resistance.
Using your trading terminal or software you just need to select this as a tool.
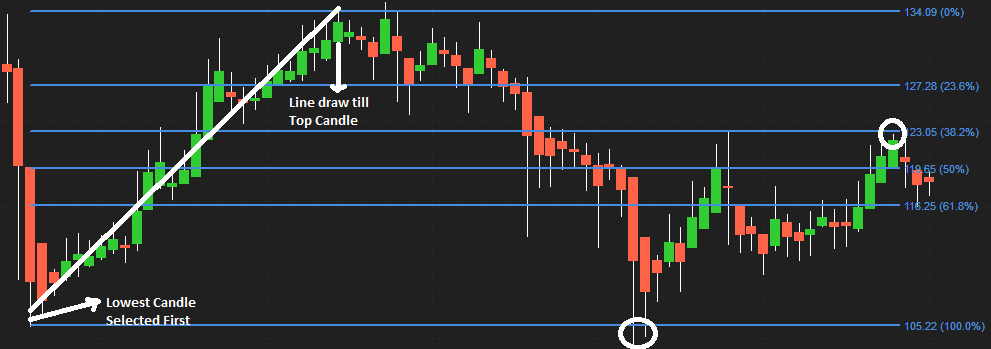
To mark the 100% move, we need to pick the most recent peak and low on the chart. Once this is identified, we connect them using a Fibonacci retracement tool.
This tool is available in most of the technical analysis software.
After selecting the Fibonacci retracement tool from the charts tool, you have to click on lowest candle on chart, and without un-clicking drag the line till the peak point.
The Fibonacci retracements levels starts getting plotted on the chart.
After you finish selecting both the low and the peak fibonacci retracements levels are drawn. This is how the chart looks after selecting both the points.
Thus making them useful for swing traders & short term investors.
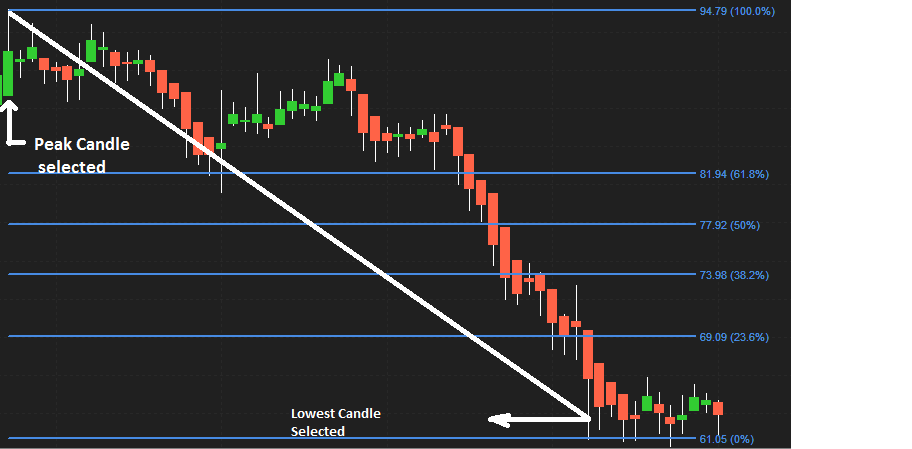
In the above day chart you can see the downward rally. I have selected the candle on peak(100%) level to 0% the lowest candle.
The stock has declined and made new low. However you can see the stock attempted to bounce back.
In the Above Day chart I plotted Fibonacci levels from bottom to peak of candle. As you can see after touching the 0% level it started falling back to 23.8%.
It was acting as support, than it broker the levels to fall below at 61.8%. As you can see in the chart once it reached the level of 100% it started bouncing back.
How To Use Fibonacci Retracement Levels?
Suppose you wanted to buy a particular stock, however due to sudden run up in the stock you missed the opportunity.
In such circumstance you can wait for a retracement in the stock.
Fibonacci retracement levels such as 50%, 61.8%, 38.2%, and 23.6% even 0% act as a potential level upto which a stock can correct.
Once you identified the levels you can opt for the trade and make a entry.
There will be Six horizontal lines drawn as given in the chart above. The first is at 100% point on the chart, the second at 61.8%, the third at 50%, the fourth at 38.2%, the fifth at 23.8% and the last one at 0%.
As a matter of fact you can use the this tool to find a position after a downtrend as well as uptrend.
In case of upward trend in a stock you can figure out the definite fibonacci points. These point will act as an entry point for your trade.
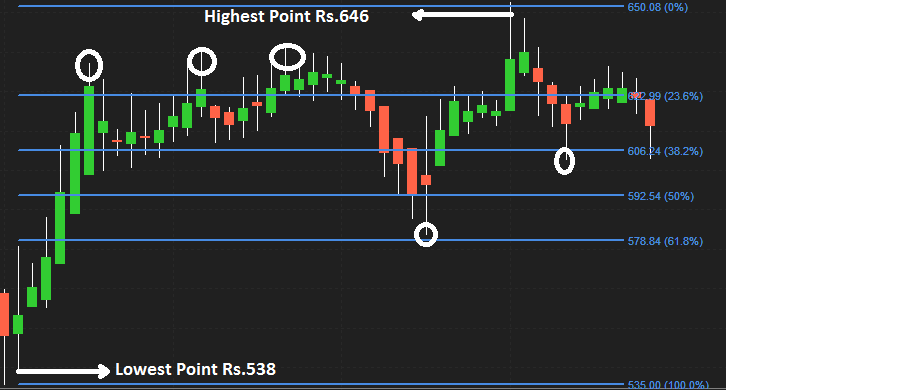
As you can see in the chart of AXIS BANK LTD. Stock rallied from Rs.536 till Rs.646. Therefore the difference is of 110 fibonacci point (646-536).
After the up move one can anticipate a correction in the stock to last up to the Fibonacci ratios.
Can you observe at 23.6% acting as a resistance. Stock started to retrace back and finally it started falling till it reached 61.8% level.
Now 61.8% is acting as an support during downtrend. The stock rallied from 61.8% till it made a high which is also the highest fibonacci level 0%.
Again the started falling till it reaches 38.2% acting as an support now before resuming its up move.
Conclusion
Whenever the stock moves either upwards or downwards, it usually tends to retrace back before its next move.
For example if the stock has run up from Rs.30 to Rs.80, then it is likely to retrace back to probably Rs.50, before it can move Rs.100.
To put it differently these retracement levels provide a good opportunity for the traders to enter new positions in the direction of the trend.
The major Fibonacci ratios i.e 61.8%, 38.2%, and 23.6% helps the trader to identify the possible extent of the retracement.
You can use these levels to position yourself for trade in stock market.
Once you get the confirmation you can make a position. Once you made the setup do not make changes to strategy every now and than.
Always Put a stop-loss as well, it might even get hit and you incur losses. However there is nothing can be done to be 100% sure of how market will behave in future.
If you have any questions or suggestion to make leave in comment box below. Till than”Keep Learning & Keep Earning”.
SLBM facility to be start in Astha.
As if now we do not have this facility. I will send your feedback to the management to see if we can start Security Lending and Borrowing Mechanism (SLBM).
Funded Trader was founded for one reason and one reason only. To FINANCIALLY EMPOWER Traders and help them to make an INCOME doing what they LOVE. The firm was established by Traders for Traders who understand that a lot of people spend tons of money on expensive Trading courses and perfecting their skills but unfortunately lack the funds to actually take their newly acquired acquired skills and actually make a living from it.