

The Most Obvious and Usually Seen Reversal Patterns in the Market
Reversal candlestick patterns (Reversal trend patterns) indicate the reversal in the existing uptrend or downtrend.
A bullish reversal pattern indicates that the existing downtrend will end and the uptrend will begin. A bearish reversal pattern suggests that an existing uptrend will end and the downtrend will begin.
A most frequently asked question is: What are the most obvious and usually seen reversal patterns in the market? Find out here.
Double Bottoms
Double bottom looks like the letter ‘W’. It indicates a drop of a particular stock or index, then a rebound, then another drop of a similar level as the original drop, followed by a rebound.
The double bottom pattern is ideally suited to analyse the intermediate to long-term change in the trend. A longer duration between the two lows helps give a better pattern of success.

Image from: forex training group
Diamond Bottoms
A diamond bottom is considered a solid bullish reversal pattern. The diamond bottom pattern expands from the left-hand side.
It then contracts into a narrower range until the price breaks the upper resistance line. This completes the pattern forming a diamond shape pattern in the chart.

Image from: niftychartsandpatterns.blogspot
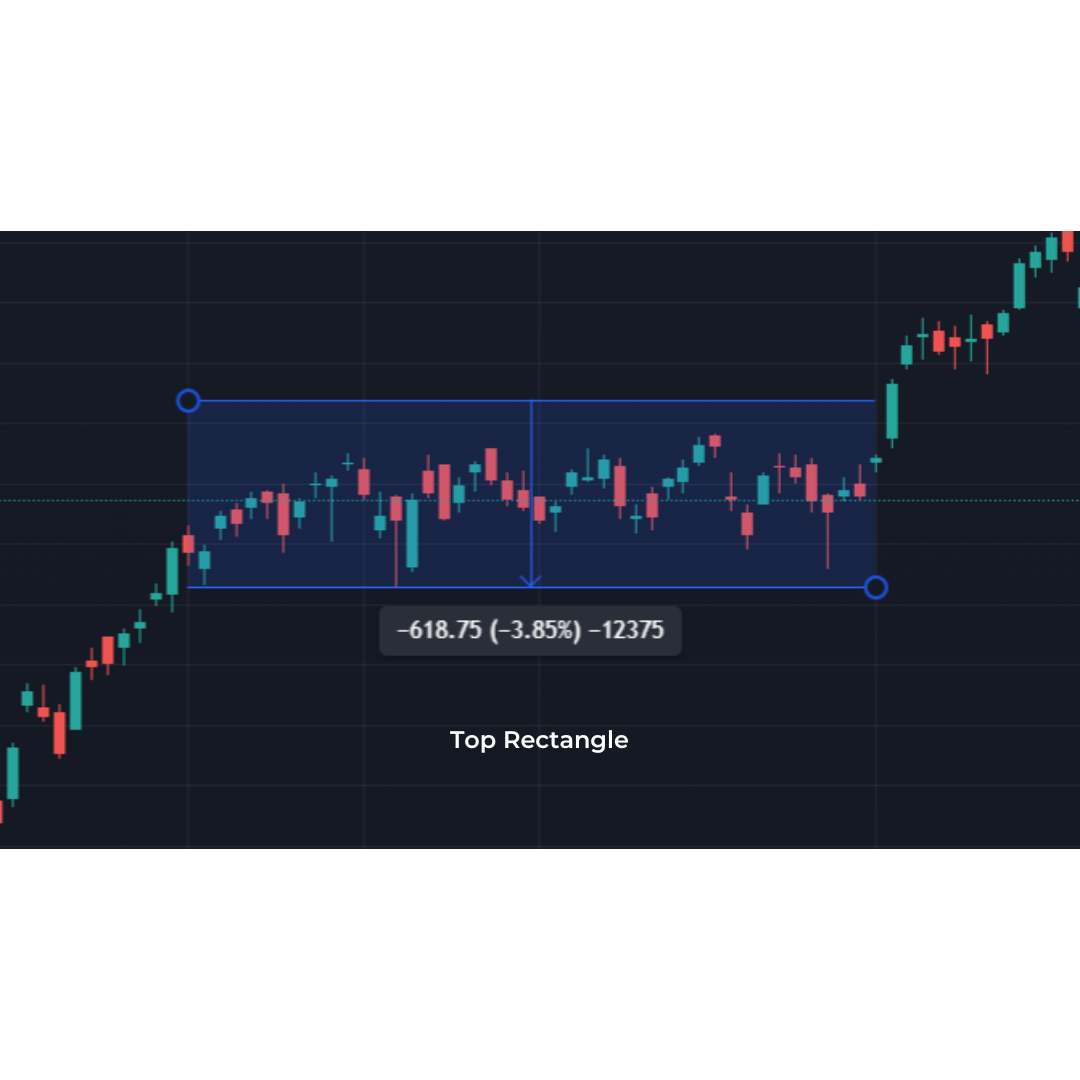
Tops rectangle
Tops rectangle or rectangle tops chart pattern occurs when the price moves up and down between the support and resistance line till the breakout occurs.
A rectangle top can break out in any direction. The price can either move upward or downward after the breakout happens. This leads to the emergence of a new trend after the breakout.
Head & Shoulders Top
For technical analysis, head and shoulders top can be easily spotted and is a popularly used pattern. It indicates a bullish to bearish trend reversal and signals an upward trend in the future. It consists of three components:
- Left Shoulder: Price increases till it reaches the peak and starts declining.
- Head: Price increases again, reaching a new higher peak.
- Right Shoulder: Price decreases, followed by an increase to reach a peak lower than the head.
Image from wikipedia

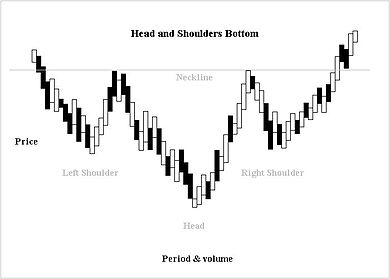
A reverse head and shoulder pattern can also be formed, whereby the price movement is as follows:
- Left Shoulder: The price decreases, hitting a price bottom and starts rising.
- Head: Price starts decreasing again, hitting a new bottom lower than the left shoulder.
- Right Shoulder: Price starts increasing and decreases again to reach the bottom, forming the right shoulder.
Image from wikipedia.
In A Nutshell
Above were some of the most obvious and usually seen reversal patterns in the stock market. Technical analysts use the above patterns to buy and sell their trades.
However, it is essential to gain thorough practical knowledge before using the above pattern. You can practice the above patterns or seek expert guidance before a full-fledged trade in the stock market.