

Traders trading in stocks, currencies, and futures use different types of trading indicators. Amongst all, Bollinger Bands is one of the most common trading tools.
In 1980, John Bollinger created bands that reflect the volatility and price of the stock.
It comprises two bands called the upper band act and lower band act. These patterns help traders develop their trading strategies.
Let’s Start With The Basics – What Are Bollinger Bands?
Bollinger Bands, broadly defined, are tools that help a trader determine the entry and exit points.
Being an easy trading tool, it is suitable for both at-home and professional traders. In general, the tool gives an idea of when a particular stock is oversold and overbought.
The indicator focuses on price and volatility to determine the trends. It ignores plenty of other relevant data and information.
Thus, a trader should not solely trade based on Bollinger Bands.
The three leading bands in the trading tool include
● The middle band is calculated by the 20-day SMA (simple moving average).
● The upper band acts are calculated by adding two times of standard deviation to the middle band.
● The lower band acts are calculated by subtracting two times of standard deviation from the middle band.
Typical values of the upper band and lower band acts
● Long-term: Bands at 2.5 standard deviations and 50-day moving average.
● Medium-term: Bands at 2 standard deviations and 20-day moving average.
● Short-term: Bands at 1.5 standard deviations and 10-day moving average.
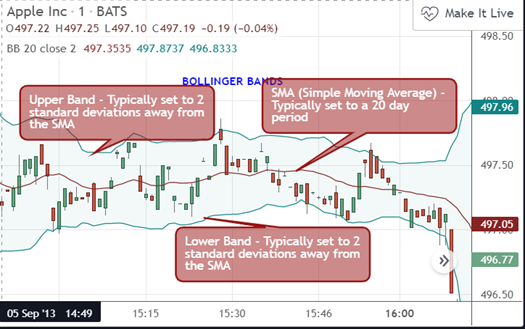
Image from tradingview
How To Trade As Per The Bollinger Bands?
Here are a few tips if you wish to trade based on Bollinger Bands:
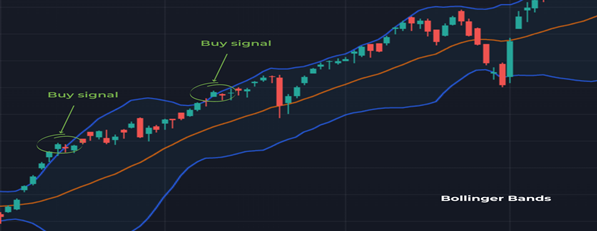
You should buy stocks when
● The lower band has a W pattern in the sideways trend.
● When the market is in an upwards direction, you can buy when prices are in the upper part of the band.
● When the market is in a sideways direction, the market moves in that particular area, you can buy when the price touches the lower area of the band.
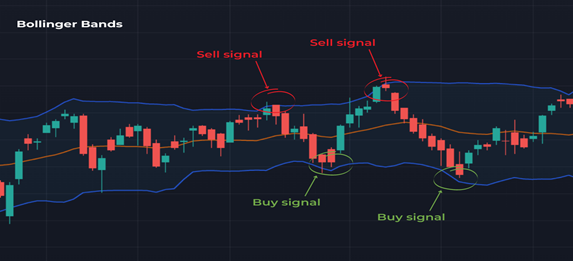
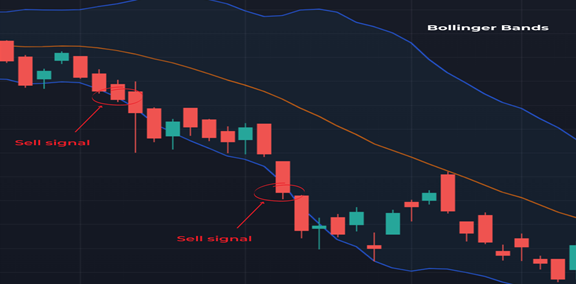
You should sell the stocks when
● When the market is in a sideways direction, the market moves in that particular area, you can sell when the price touches the upper area of the band.
● When the market is in a downtrend, you can sell/short when the price touches the bottom part of the band.
Other Significant Interpretations About The Bands
● Volatility drops when bands contract; hence, there are high chances of sharp price changes.
● The price line suppressing the band’s range indicates a continuation of the current trend.
● When the price is near the upper band act, it suggests an overbought market.
● When the price reaches the lower band act, it depicts an oversold market.
● When the middle line and price line meet, it’s time to exit the trading market.
● Traders should sell stocks when the price line is lower than the lower band.
● They should buy the stocks when the price line shakes up the upper band.
Final Words
To make your trading successful, it’s vital to plan things strategically, instead of using one indicator to determine the highs and lows, research well.
Finally, you need to follow a few top trading tips and Bollinger Bands to identify strong and weak trends.