
Introduction
A bearish reversal pattern is a combination of candlesticks during an uptrend. It indicates that the trend will reverse when the price falls.
This is usually the case when bears replace the bulls over time. In other words, the bearish reversal pattern indicates that sellers have taken over the buyers.
You can observe the pattern during an upward trend movement.
Traders usually decide whether they need to sell or buy stocks to earn profits. Learn more about the bearish reversal pattern here.
What is a Bearish Reversal Pattern?
Bearish Reversal Pattern, broadly defined, indicates a decrease in stock prices. Traders use bearish candlesticks to sell their stocks in the market.
Investing by checking the patterns will help you to safeguard your investment.
However, you should always wait for the closing of the second candle. This will help you decide whether you need to sell or buy the stocks.
Identification of bearish reversal pattern
When a green candlestick follows a larger red candlestick, it indicates a bearish pattern.
Apart from this, a vital thing that indicates the bearish pattern is the closing price of the bullish candlestick being equal to or less than the opening price of the bearish pattern.
The two major types of bearish patterns include:
- Symmetrical triangle
- Descending valley
Let’s discuss them briefly.
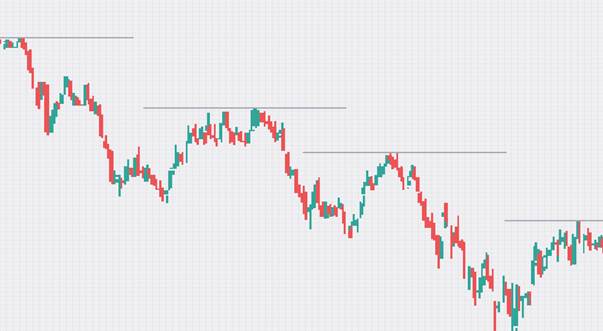
Descending Valleys
It is a bearish reversal pattern with one trend line connecting a series of lower highs.
The other trend line (horizontal) connects the series of lows. The core purpose of this pattern is to indicate the lower price.
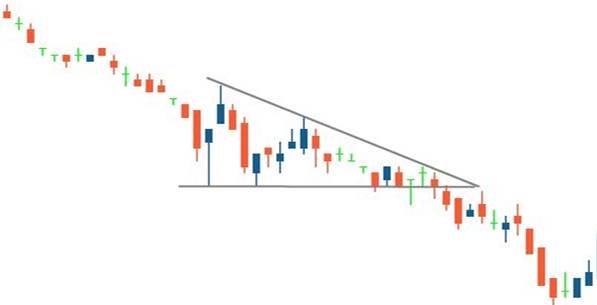
Symmetrical Triangle
When two converging trend lines connect, it leads to the formation of a symmetrical triangle. This pattern is a bearish symmetrical triangle with converging lines.
Trading In A Bearish Reversal Pattern
Trading according to the bearish reversal pattern involves a significant amount of risk. It is an indicator of the potential shift in the stock market.
Before trading, you need to wait for consecutive days. If the market rapidly falls, you can take your position and trade.
In addition, a stop-loss would be beneficial if you want to enter a new short position.
Pros & Cons of the Bearish Pattern
A trader who knows how to identify patterns can benefit from the pattern. Listed below are the pros and cons of bearish reversal patterns.
Pros
● Easy to interpret and recognize
● Best way to predict the accuracy of the market
● Effectively used as a technical analysis tool to determine the market
● Easy to combine with other technical indicators
Cons
● Zero guarantees about the market trend reversal
● Before the price action, you require the confirmation of direction
● Large bearish candlesticks push the level of stop-loss higher, affecting the trader
● The indicator is not 100% accurate if there are fluctuations in the market trends
Final words
Pairing the pattern with other tools will help you to predict market direction. It is easy to recognize because it usually occurs after an uptrend.
As a trader, you need to understand the bearish reversal pattern in detail. This is because it will help you to create a profitable trading strategy.