
Intraday trading of stocks can be difficult for inexperienced investors. Traders must keep a close eye on 7 indicators to get an edge over competitors in the stock market.
They can acquire stock market education through stock market news as well as these stock market indicators. This article will highlight the most important seven indicators for intraday trading.
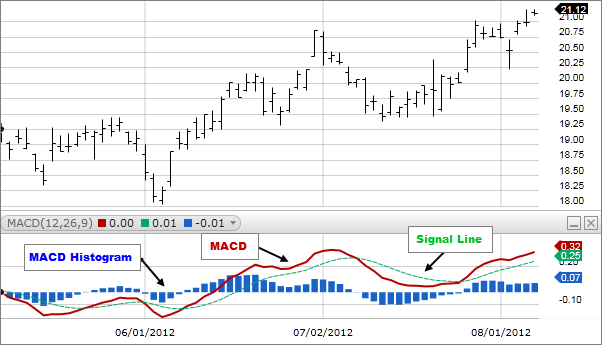
Moving Average Convergence Divergence (MACD)
It is a leading indicator that is widely used by fintech giants to track stock market indices during the day which depicts the connection between two security price moving averages by calculating the difference between trading exponential moving averages and displaying it as a line graph.
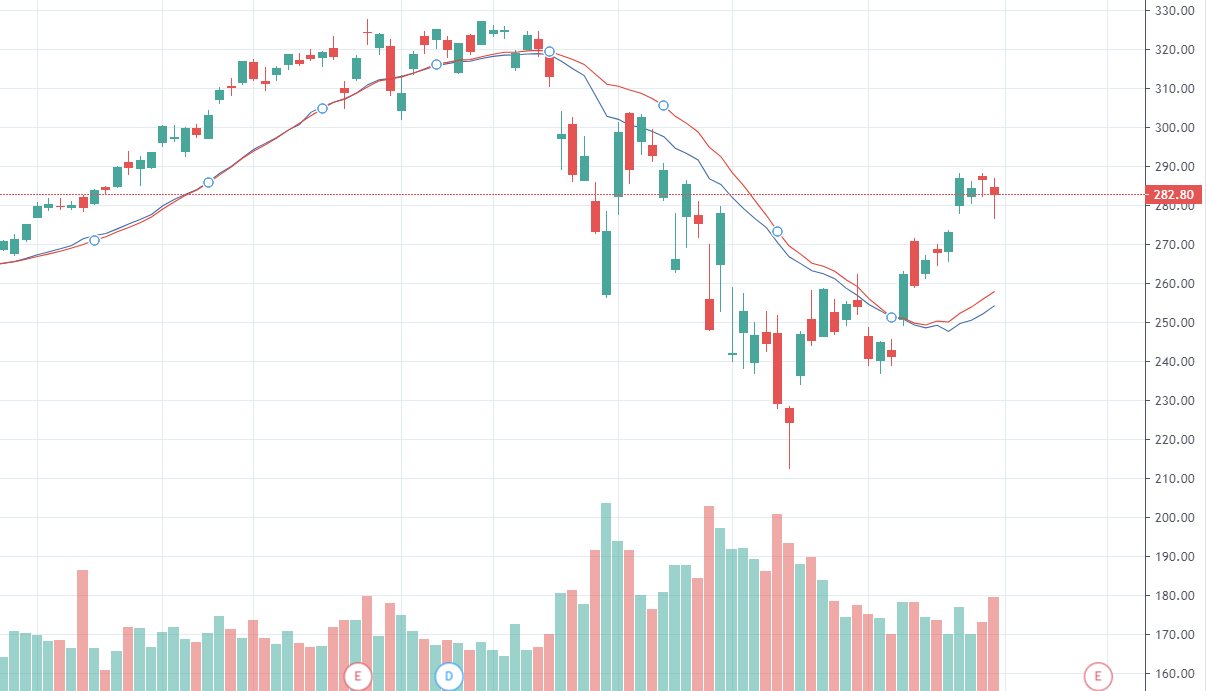
Volume Exponential Moving Average (VWAP)
It’s a trading indicator that shows the average price at which a stock has traded during the day by considering both the volume and price and giving price points with large volume greater weight.
This helps you to find excellent entry/exit moments, measure relative strength, and grasp price points of interest.
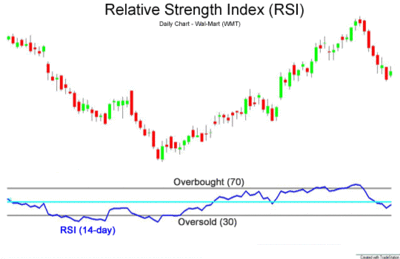
Relative Strength Index (RSI)
It was invented by Welles Wilder in June 1978 and is one of the most widely used momentum indicators trading strategies in the world of trading stocks.
It examines the size of average gains and average losses of security to make conclusions about its strength and weakness over a set time to quantify the frequency and proportion of price movements of security in stock markets.
Call to action: Open Demat account
Open Free Demat Account In Easy 3 Steps
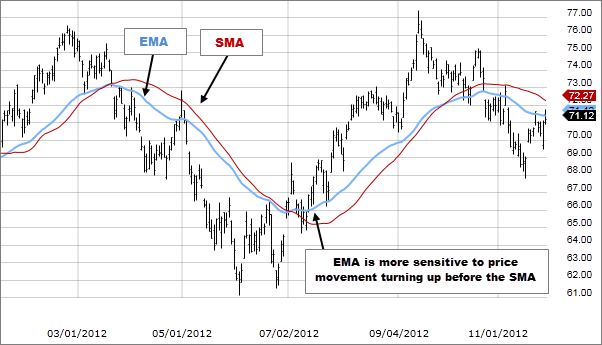
Exponential Moving Average (EMA)
The average price of the trading security for a given period is represented by the EMA, which places more emphasis on recent prices.
Recent data items in the collection are given more weight. The EMA’s value is determined using two separate periods.
Types of Exponential Moving Average (EMA) indicators
9 EMA
It is incredibly popular and moves at a rapid speed. It is frequently employed as a directional filter and gives the most accurate and medium-term moving average.
When it comes to trends, the 9-period EMA has to be higher than the 30-period WMA. Both moving averages must be separated from one another. The trigger bar for the buy setup will be the first indicator that closes below the 9EMA.
21 EMA
The most current price is given a 9.0% weight by the 21-day EMA, but just 1.9% by the 100-day EMA. As a result, EMAs estimated over shorter time intervals are more sensitive to stock market price fluctuations than EMAs calculated over longer time intervals.
The closing prices of the previous 21 days are tallied up and the total is divided by 21 to get a 21-day moving average. Only the prices from the previous 21 days are used in the calculations.
50 EMA
It focuses over the 50-yard line, keeping an eye on mid-term chances and reasonable counter swings after aggressive trends, whether they are higher or lower or when the bulk of people misread price behavior.
The criterion for closing transactions with a 50-day moving average is straightforward.
Hold your transactions until the price action in the opposite direction of your trade breaks your 50-day moving average. If you’re long, you’ll exit the trade whenever the price falls below the 50-day EMA.
200 EMA
It serves as a long-term indicator in cases where a reversal has occurred when the stock crosses the 200-day moving average.
Traders use it as a trading strategy, as moving averages are incredibly useful and informative. On the charts, it appears as a line, indicating the average price for the previous 200 days (or 40 weeks).
This helps traders determine if the trend is up or down, as well as identify potential locations of support and resistance by identifying long-term trends of trading stocks.
Conclusion
In the Indian stock market, 7 indicators are presumably recognizable to you if you are familiar with stock indices.
If not, technical analysis is essentially a trading strategy that enables you to look at previous data and predict potential price patterns and serves strong stock market tips.
To create a financial report mapping tool that can compete with any tool on the market, we will examine the stock market news and technical indicators in this post and show you how to depict them using Highcharts Stock.