
About 4 Bullish reversal patterns
The stock market is full of complexities and technical terminologies. When it comes to candlestick patterns, there is a lot to learn and explore.
Stock markets take a dip that might scare certain investors. However, the downtrend is not permanent and will reverse to an uptrend. Candlestick patterns indicate the end of the existing downtrend and that it may reverse into an uptrend. These are known as bullish reversal patterns.
Here, we have stated 4 bullish reversal patterns that you can use to forecast the reversal of the existing downtrend and make trading decisions:
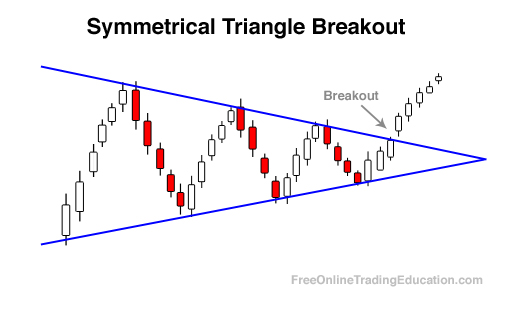
Symmetrical Triangle
Symmetrical triangle indicates the price consolidation before the price breakouts. It forms as the ascending support lines and descending resistance lines meet at a certain point as the security trading range becomes smaller.
In simpler terms, the price of the index or the stock will move up and down between the two trend lines that are moving forward to form a triangle, and then breakout in either direction to create a new trend.
Image Source: freeonlinetradingeducation
Measured Move Up
Measured move up is a three-phase reversal pattern.It includes a reversal advance, consolidation/correction, and continuation. It is explained as follows:
Reversal Advance: It is the first advance that begins after the price is at the lower edge after a decline. The price starts increasing and rises in a fair and orderly fashion, marking various rising peaks. Sometimes, it also marks an initial trend change.
Image Source: forex.academy

Consolidation/Correction: After a price advances over a period of time, correction or consolidation can be witnessed. There could be a 33-67% retracement as part of the correction or consolidation. The bigger the advance, the bigger the correction would be.
Image Source; forex.academy
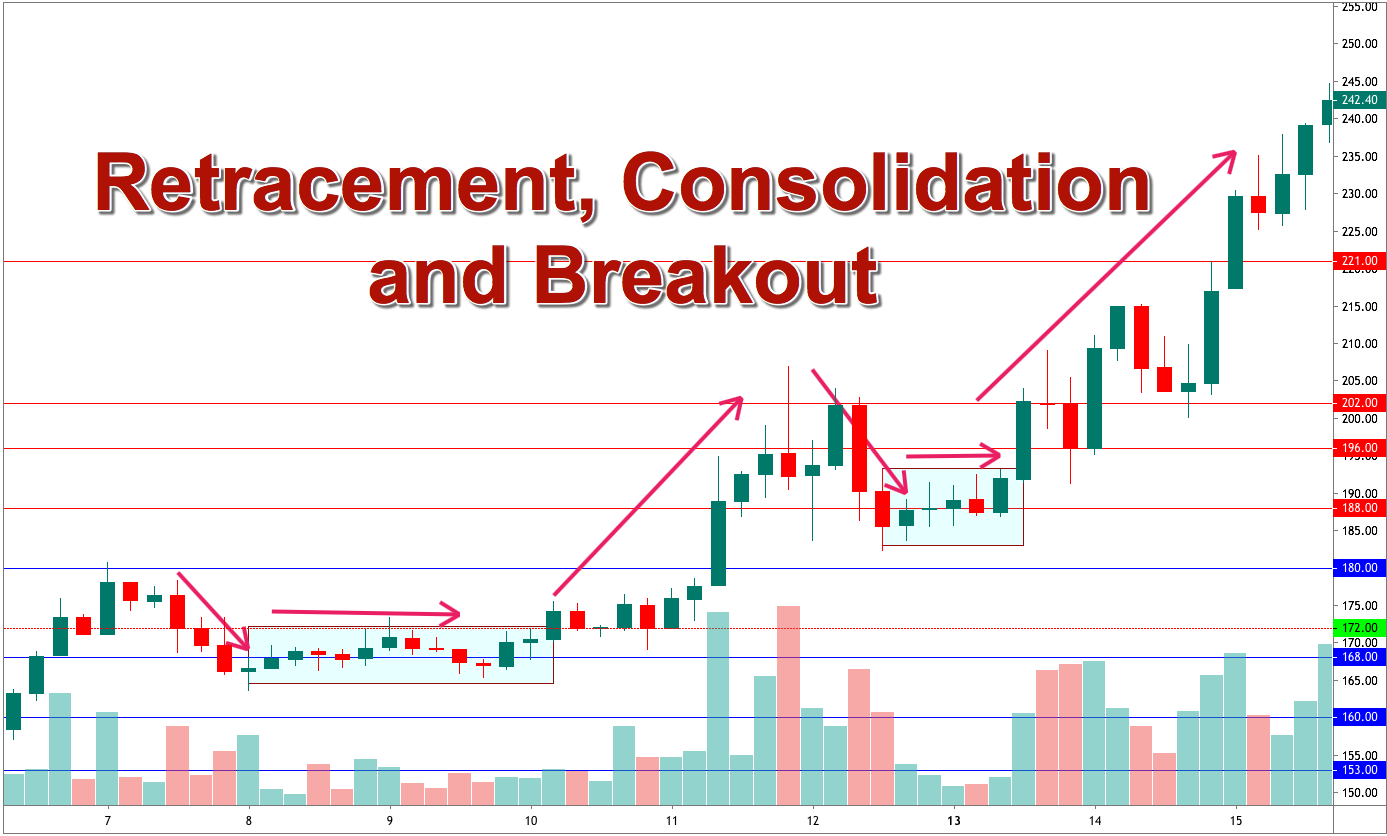
Continuation: This again marks the advance of the price. The advance can be projected by applying the distance between the low and high of the initial advance to the lows after the retracement.
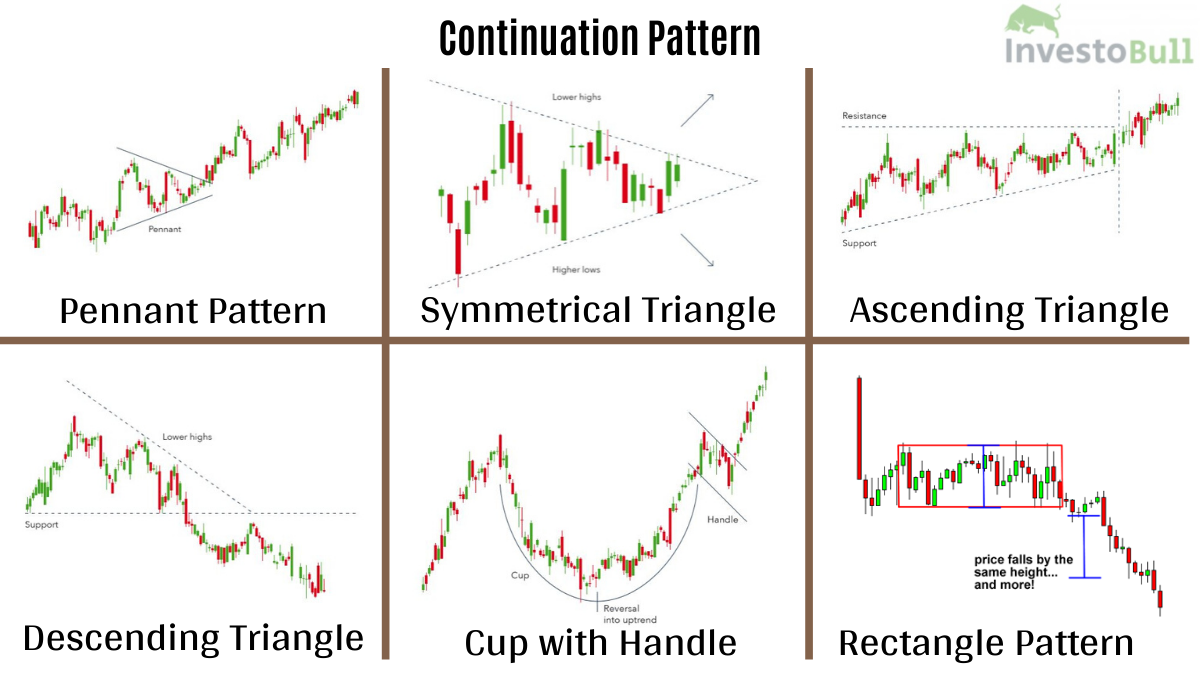
Image Source: investobull.com
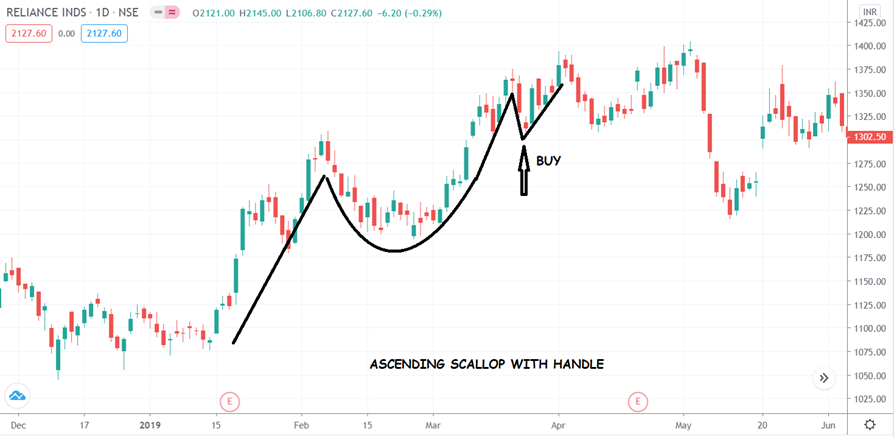
Ascending Scallop
Ascending scallop is usually observed in a bull run. It begins with a price drop that is usually less. It starts reversing, thus, forming a wide base tilting towards the upper side.
The price continues to increase, thus, making the whole pattern appear like ‘J’. After that, there can be a breakout of price in either direction.
Image Source tradingcampus.in
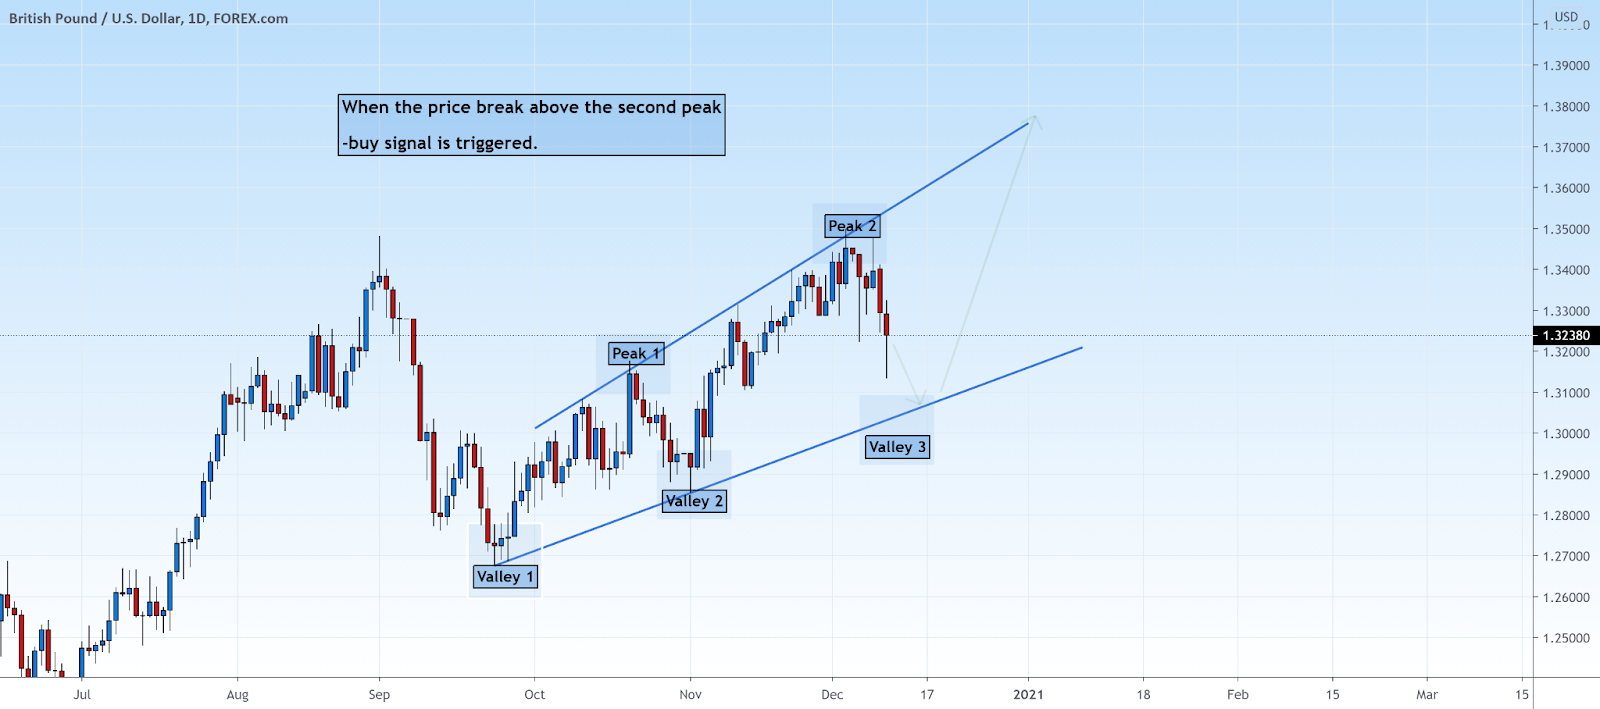
Rising Valleys
The pattern is usually formed with three upward trends. In this pattern, consecutive 3 rising valleys are formed, with each valley being higher than the earlier one.
The valleys are usually similar in the sense that either all three valleys are wider or narrower. There is a price uptrend and the pattern is usually confirmed if the price closes near or above the highest peak.
Image from tradingview
In A NutshellIdentifying bullish reversal patterns has been helping stock market traders and technical analysts make informed decisions.
Closely monitoring the candlestick patterns will help you identify all such patterns, based on which you can make your trading decisions.