
What Is MACD?
(MACD) Moving Average Convergence and Divergence is a distinctly very popular momentum indicator used in Technical Analysis. It can be used to identify the overall trend of a security.
The Moving Average Convergence and Divergence indicator was created by Gerald Appel in the late 1970s . It is a combination of 2 different type of Moving Averages (MA).
Generally we use Exponential Moving Average (EMA) for calculation of MACD. The basic reason for taking the two moving average is that one should be of shorter time period and the other longer time period.
It is calculated using a 12 day EMA and a 26 day EMA. Another key point is both the EMA’s are based on the closing prices. We deduct the 26 EMA from the 12 day EMA, to estimate the convergence and divergence value.
However this is not always the case ,for instance you can use Short-term intervals – 3, 5, 7, 9, 11, 12, 14, 15-day. For Long-term intervals – 21, 26, 30, 45, 50, 90, 200-day.
Besides this 9-day and 12-day duration are more popular in short term. Where as 26-day, 50-day intervals are more used for long term intervals .
How to calculate Moving Average Convergence and Divergence (MACD)
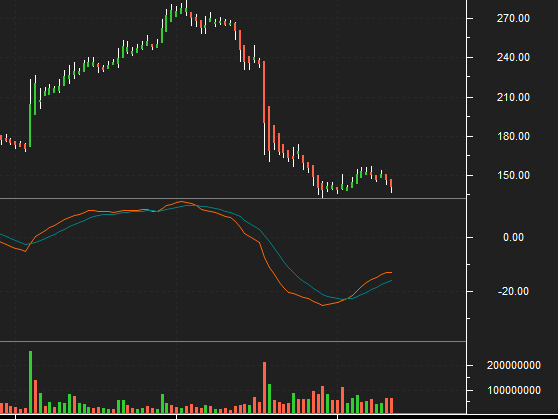
In the above chart you can see two lines oscillating without boundaries. The crossover of the two lines give trading signals & opportunities for buy and sell.
MACD value = ( 12 day EMA – 26 day EMA ). The result of this calculation is the MACD line.
A 9 day EMA of the MACD, called the “signal line“, is then graphed on top of the MACD line, which can function as a trigger for buy and sell signals.
Traders may buy the security when the MACD crosses above its signal line and sell the security when the it crosses below the signal line.
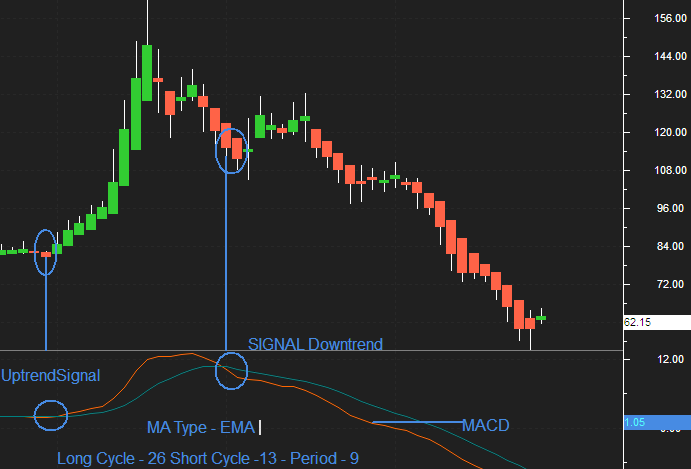
However we have used 13 days as shorter cycle and 26 days as longer in above image.
General parameter of MACD
- 12 day EMA
- 26 day EMA
- MACD line (12D EMA – 26D EMA) represented by the orange line
- 9 day EMA of the MACD line represented by the blue line
You do not need to calculate this complex mechanism in order to know the values of MACD.
As now most of the companies including your broker will provide you with the terminal, where one can easily apply this indicator.
So ,instead of calculation we will be knowing the basics and how to use it for Trading or Investing .
The values of 12, 26 and 9 are the majorly used with the MACD, though other values can be used depending up on your trading goals.
The shorter moving average (12-day) is faster than the longer moving average (26-day) in reacting to price changes in the underlying security.

What one can understand from Moving Average Convergence and Divergence
- The view point is bullish when the MACD line crosses 9 day EMA. Whenever MACD line is greater than the 9 day EMA a trader should look at buying opportunities .
- The view point is bearish when the MACD line crosses below the 9 day EMA. whenever MACD line is lesser than the 9 day EMA a trader should look at selling opportunities .
- MACD crossing above zero (signal line) is considered bullish, while crossing below zero is bearish.
- Whereas when it turns upwards from below zero it is considered bullish.
- When it turns down from above zero it is considered bearish.
This unique composition of trend and momentum can be applied to Hourly, daily, weekly or monthly charts.
As shown in the above chart, when the MACD falls below the signal line, it is a bearish signal which indicates that it may be time to sell.
On contrary, when the MACD rises above the signal line, the indicator gives a bullish signal, which guide one, that the price of the asset is probably to experience an upward momentum.
The MACD and signal line move above and below the center line or zero line to signal a trend such as overbought and oversold conditions.
When these two EMA move close to each other, it is called convergence, and when they move away from each other ,it is called divergence .
Conclusion
Hope you now have better understanding of this fantastic technical indicator, furthermore we hope you use this indicator & make it a real experience in your trading & investing.
I will end this article with a quote truly based for traders. Thanks for your patience while reading. If you have any questions or feedback do let us know through comments below.

This is very nice indicator for traders and investors. I am using this indicator since last 10 days and also watched the result, which were positive. But I want to know further about this indicator i.e. for applying 15, 30 min, hourly time frame, is it necessary to change indicator’s days (12, 26 & 9). If it is “yes”, then how many days I have to put in.
Because I am doing intraday and mostly I am using 15, 30 min and 1 hr time frame, if you guide me, it will be very helpful to me.
Please guide me.
Thanking you.
Hi, thanks for your comment, please post your query on our community page and our traders like you and experts will be there to reply on your post