

What Is Simple Moving Average (SMA)?
Simple Moving Average (SMA) is one of the core technical indicator used by traders & investors for technical analysis of a stock, index or any securities .
Simple Moving Average is calculated by adding recent closing price of a stock and than divide by number of days (time period).
Before we jump to learn in depth ,let us know the basic arithmetic behind simple average .
We all have studied in school about averaging concept or even in our daily life we do it regularly. When we ride motorcycle or drive car we check its average.
In sports too you have seen batsmen in game of cricket his average score ,for example- if he had scored 60 , 54 , 76 , 98 ,27.
In last 5 matches than we calculate it by adding all scores & dividing by no. of matches played . The average would be 63. SMA is just math.
So by calculating average of a batsmen one can predict or assume that he would score at least this much runs .
This case is not always true however the chances remains very high .
Similarly SMA helps in predicting the future trend & determining if an asset price will continue or reverse a bull or bear trend.
So basically its a trend direction indicator .
Formula For Simple Moving Average (SMA)
SMA = A1+A2+…+An / n
where An= the price of an asset at period n
n= the number of total periods
Moving Average is a average calculation where the latest data is included, and the oldest is excluded .
You do not need to calculate it manually, whichever trading platform you are using it will be available as its one of the basic indicators in Stock market.
SMA specifically tells If it is points up, means that the security’s price is increasing. If it is pointing down it means that the security’s price is decreasing.
Make sure to select the longer the time frame for the moving average, as it flatten the simple moving average.
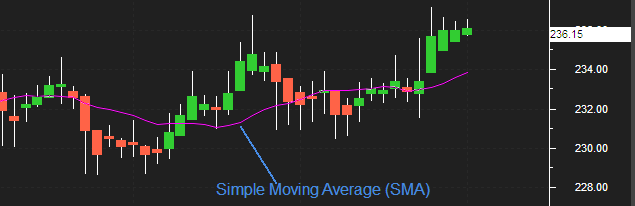
In this chart pink line indicates the simple moving average, its 14 days period average calculated.
You can see the moment a candlestick chart goes above the SMA it’s sign of trend reversal. The uptrend continues for couple of sessions.
Whenever Price crossing SMA is often used as trigger for trading.
When prices cross above the SMA, you might want to go long (buy) or cover short (sell) when they cross below the SMA, you might want to go short or exit long.
You can use the longer the period of the SMA, for the smoother result. first thing to remember that SMA depends primarily on historical data .
By using this we are only analyzing the possibility in future .
A 200-bar SMA is commonly used for the long term trend whereas a 50-bar SMAs are typically used to measure the medium trend.
Simple Moving Average Crossover Strategy
Too many traders have tried to use the SMA to predict the exact sell and buy points on a chart.
Although if market are sideways the plain Moving Average we have discussed will not be sufficient.
As it may give too many signals . To counter this you can use SMA Crossover Strategy .
Also know as Double cross-over method. Double crossovers involve one relatively short moving average (less day ) and one relatively long moving average.
It will help you to take less trades in sideways market. It’s an improvisation of Simple Moving Average.
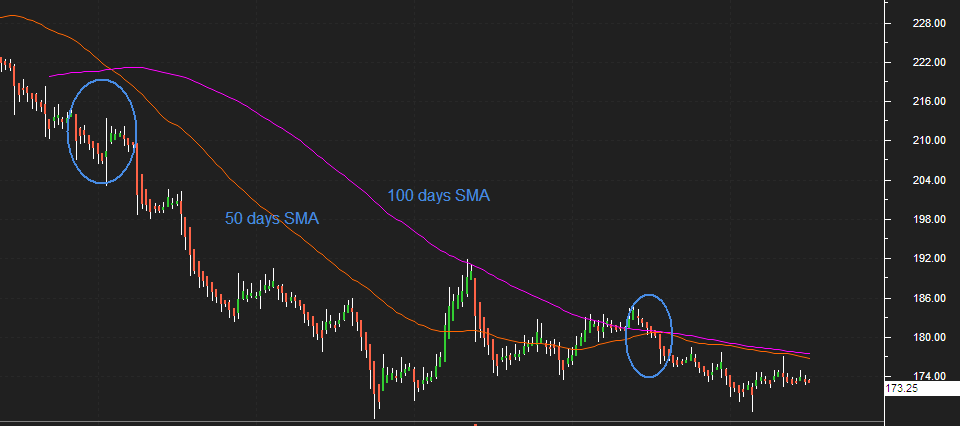
As you can see in the chart, we have used 100 day SMA with 50 day SMA .
One of the most popular simple moving averages to use with a crossover strategy are the 50 and 100 day.
When the 50-simple moving average crosses above the 100-simple moving average, it creates a golden cross.
This will help in smooth out the entry and exit positions from market .
In the chart above pink line represent 100 day SMA & Orange is 50 day SMA .
The Pink 50 day EMA line is closer to the current market price when compared to the orange 100 day EMA.
In a Moving Average crossover system, instead of the usual single moving average, the trader combines two moving averages.
Points to Remember
A Bullish crossover occurs when the shorter moving average (50 days) crosses above the longer moving average (100 days).
A Bearish crossover occurs when the longer moving average (100 days) crosses above the shorter moving average (50 days).
A trader can use various combination to create a Moving Average cross over strategy.
Conclusion
You can apply various MA strategy depending up on your need but do not rely only on this .
First thing to Remember while placing trades is Support & Resistance .
After that you can use numerous indicators to analyse the trend,
You can use other Indicators such as EMA (Exponential Moving Average ) RSI (relative strength Index ) or MACD (Moving Average Convergence Divergence) for better technical analysis.
We will try to discuss all major indicators in upcoming blogs till than try applying this and learn different experiences you face while trading .
Start learning slowly there is no hurry. once you understand the core basic of stock market , you can create and back-test your own strategies .